You were hired to perform a Service Optimization Tuning (SOT) exercise on ClickSoftware Service Optimization. You licensed Xoom and SOT Toolkit in order to super-charge your capabilities to deliver a good job for your customer. So where do you start?
This post will be your step-by-step guide through this process.
Assumptions
In order to avoid making this longer than necessary, we will make the following assumptions:
- You already installed Service Optimization and an up-to-date release of Xoom 3 on the host.
- The machine is capable of running PowerShell 3 or newer.
- You imported the customer database into Service Optimization, and performed all necessary preparatory work.
- SOT Toolkit will be installed on the same host as Service Optimization and Xoom.
Installation and initial environment setup
First, run the installer provided by Xoom Tools. The steps are straightforward and there are no particular decisions that need to be made. The installation folder can safely be kept at default location unless you have a good reason to put it elsewhere. The working files for the SOT will be located at a separate location anyway, so this just affects where the.
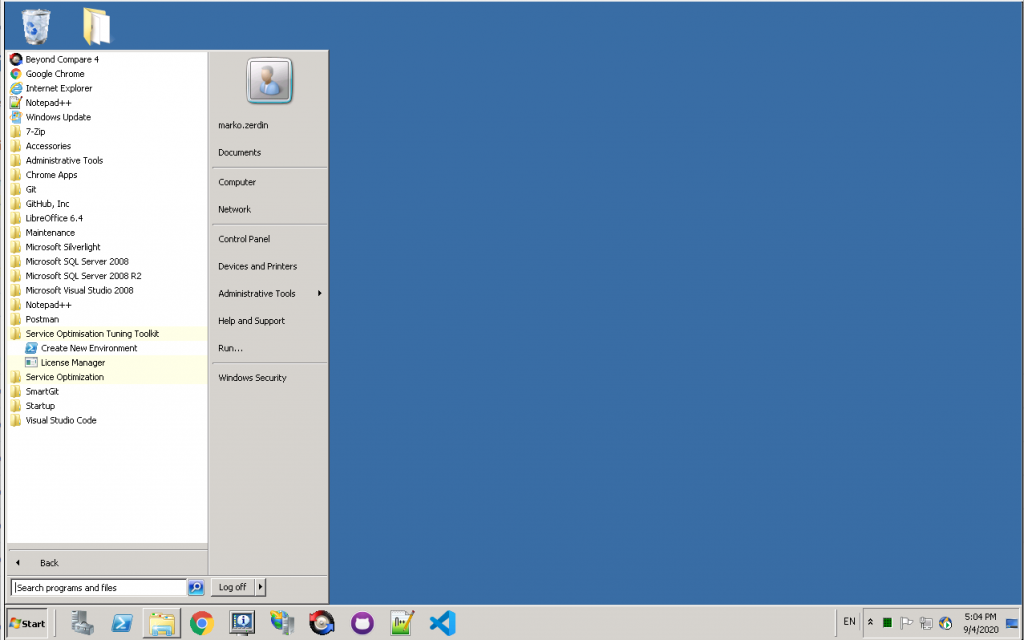
After the installer has completed, there will be a new Start Menu entry for the Toolkit:
Licence Manager is used to create a licence request and apply the licence. It is functionally equivalent to the Xoom Licence Manager.
Create New Environment runs a script that asks a number of questions and at the end creates a work space (called an “environment”) for our SOT. This is our next step, so go ahead and click on Create New Environment.
This will open a new PowerShell window and ask a number of questions, as shown here:
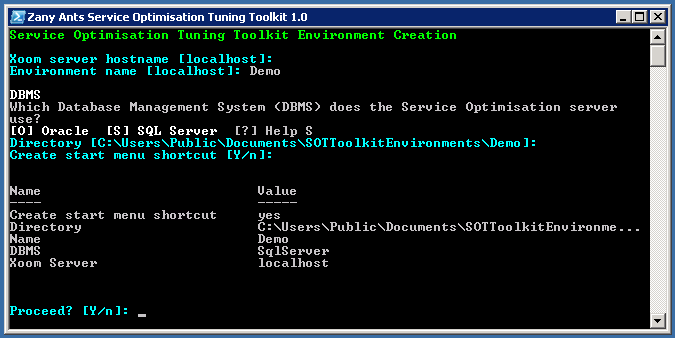
The script will ask a number of questions, usually providing defaults in square brackets. Simply press Enter if you want to accept the default, or provide the answer. The questions are:
- Xoom server hostname. Defaults to localhost, which is the right answer in our case.
- Environment name is the name of the SOT project that we want to work on. We called it Demo in the example, but you may want to give it the customer name, or name that identifies the project. SOT Toolkit allows there to be multiple environments for multiple SOTs on different projects that run in parallel, in which case the names are more important than if there is a single SOT.
- DBMS (Oracle or SQL Server) that Service Optimization uses. The Toolkit has a few templates and scripts that distinguish between the two database engines, and this parameter helps it know which option to use.
- Environment directory. By default, the environment’s folder will be located in the SOTToolkitEnvironments folder in Public Documents folder, so that multiple users on the same host can access the files.
- Create Start menu shortcuts. If yes, the script will create handy shortcuts for both PowerShell command line and PowerShell ISE (Integrated Scripting Environment) that will initialize into the environment’s folder. We warmly recommend that you create these shortcuts.
Once the questions have been answered, the script summarizes the environment information and asks whether to proceed, When you confirm, the environment will be created. If you chose to create Start menu shortcuts, you will see the new shortcuts named after the environment:
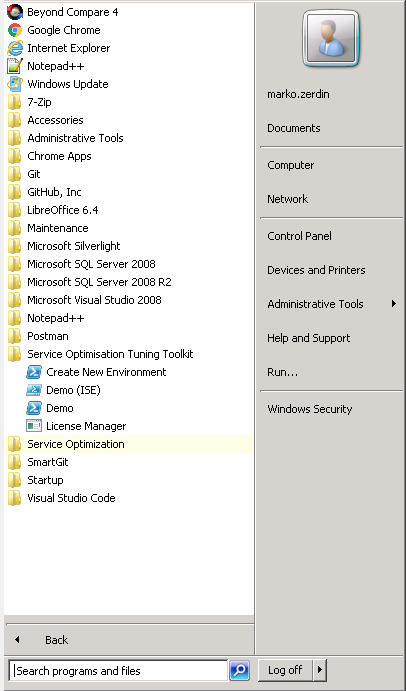
The two entries start a PowerShell session for the environment, either in command line or in the ISE. ISE is easier to use, so the work is typically done there. The only situation where you would want to avoid it is if you wanted to run multiple sessions in parallel, as ISE is single-threaded and won’t let you do that.
Configure Xoom and install the starter kit
Now it’s time to start the environment. Click on the ISE link, and ISE will open with something like this (although the location of the scripting window will probably be on the top):
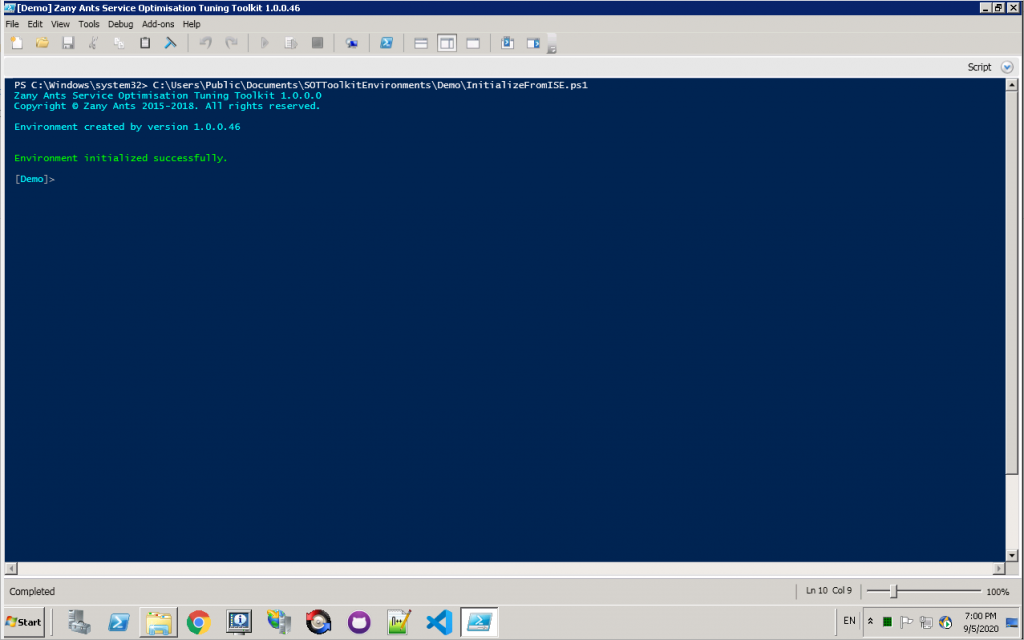
Press F5 (or click on the play icon to run the script), and the environment will load all necessary modules to initialize itself. The script window will disappear and the prompt with the name of the environment (in this case Demo) will appear:
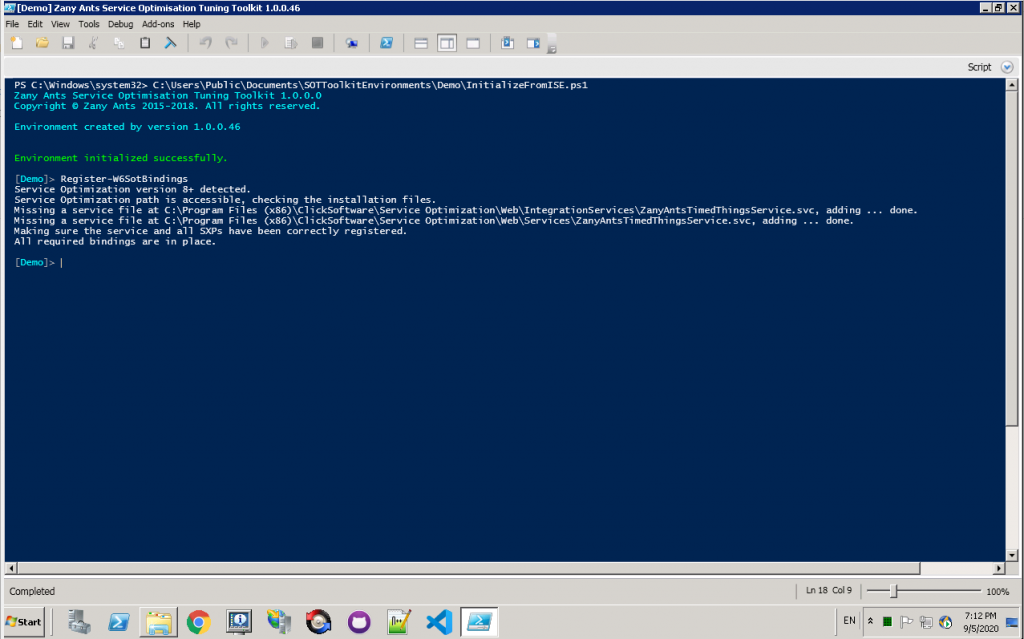
Before we can start with the SOT, we have to make sure that all required services are registered. We do this by invoking the Cmdlet
Register-W6SotBindingsWe only need to do this once on each Service Optimization application server, at least until the database is replaced with an image that doesn’t contain the binding. Running the Cmdlet again is harmless because it will simply verify whether the bindings exist and do nothing, so you can safely run it again just in case if unsure.
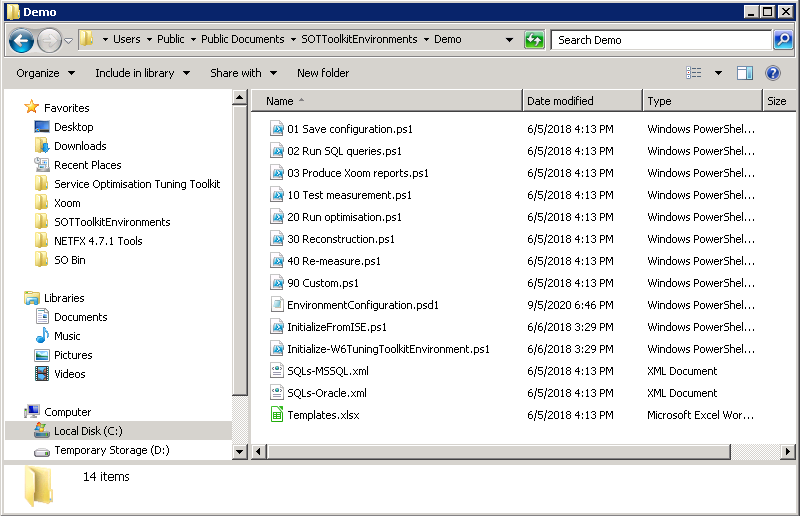
Now you are ready to copy the starter kit files and start the actual work. Simply invoke the Cmdlet
Copy-W6SotStarterKitwhich will copy the relevant files into your environment folder. We’ll look into the starter kit files in detail in the following sections, but here are the contents of the environment folder at this point:
The environment is now ready to start work on the SOT.
Overview of the SOT Toolkit starter kit
The starter kit was developed to give you, in a convenient and approachable form that requires minimum changes, all the building blocks you need in order to start your SOT. With a couple of exceptions that we will address below, script names start with numbers in order to communicate the order in which they should be used.
The suggested process follows good practice from manual SOTs:
| Stage | Description | Scripts |
|---|---|---|
| 1. Data | Understanding the data is fundamental to understanding any issues inherent in either the data itself or the workflow it is subjected to. | 02 Run SQL queries.ps1 |
| 2. Configuration | Understanding the current configuration is important in order to understand the causes of any reported problems and to plan changes that will lead to improving system performance. | 03 Produce Xoom reports.ps1 |
| 3. Experiments | Once we have a good understanding of the situation, we need to define alternative configuration scenarios and run experiments to see how they perform in practice. | 10 Test measurement.ps1 20 Run Optimisation.ps1 90 Custom.ps1 |
| 4. Decision | When we have run the experiments, we select the best performing scenarios, review their pros and cons with the customer (potentially returning to stage 3 for some more) and decide on final configuration changes. | 30 Reconstruction.ps1 40 Re-measure.ps1 90 Custom.ps1 |
There is a lot of work that can’t be easily generalized, such as data preparation and clean-up prior to running experiments, but SOT Toolkit starter kit tries to give you at least some help with each of these stages. The following section address each stage in more detail and document what the starter kit and indeed the Toolkit bring to the table.
The scripts in the starter kit follow a few conventions that make them uniform in structure and easy to use.
First, they put all simple parameters at the top. Each parameter is preceded by its description. Make sure to read the description in order to understand the role of the parameter as there may be some subtlety in some cases. For example, here is script “02 Run SQL queries.ps1” with parameters $queryXmlFilePath, $templateFilePath and $outputFilePath at the top.
# The path to the query XML file containing the SQL queries that should be run
$queryXmlFilePath = 'SQLs-MSSQL.xml'

# The path to the Excel template file containing a sheet called
# DatabaseQueryTemplate that contain representation template for database query
# results
$templateFilePath = 'Templates.xlsx'

# The path to the Excel document containing SQL query results
$outputFilePath = '02 Database query results.xlsx'

# Action!
New-W6DatabaseQuerySpreadsheetFromXml `
  -QueryXmlPath $queryXmlFilePath `
  -TemplateSpreadsheetPath $templateFilePath `
  -ResultSpreadsheetPath $outputFilePath
Second, some scripts require larger changes, or changes deeper in the code. Such instances are marked by comments that start with “TODO:” followed by a brief description of the customization task that is required. There may be further comments around this comment to explain the context and options, where those options are more complex. For example, here is a section at the end of script “10 Test measurement.ps1” containing two TODO comments:
# Load the Excel templates
# TODO: Review file and worksheet names to make sure the right thing is being tested.
$templates = New-W6SotTemplates `
  -TemplateSpreadsheetPath .\Templates.xlsx `
  -HeaderTemplateName MeasurementHeader `
  -MeasurementTemplateName ScheduleMeasurement `
  -SqlTemplateName DatabaseQueryTemplate

# Store the measurements in the Excel file
# TODO: Review result file name.
Merge-W6SotMeasurementsIntoSpreadsheet `
  -Measurements $measurements `
  -Context $context `
  -Templates $templates `
  -ResultSpreadsheetPath '10 Test measurements.xlsx' `
  -AutoInsertMeasurementHeader
Finally, some scripts will contain a block comment at the top explaining the purpose of the script and how it should be used, as well as highlighting any caveats that you should be aware of. Please read this carefully and make sure you understand its meaning, as missing some of this could result in a waste of time and subpar results. Here is an example from script “10 Test measurement.ps1”:
<#
   The purpose of this script is to test the measurements that are being developed and their
   representation in an Excel template.

   The script imports the file '90 Custom.ps1' which defines the actual measurements. It is
   the recommended practice to keep measurement definitions there, as that will make those
   same definitions available to all other scripts.

   Please find all instances of "TODO:" string below and take appropriate action prior to
   using the script.

   IMPORTANT NOTE: Both Microsoft Excel and LibreOffice lock the files that are open. The
   script will therefore fail if either the template file or the results file are open when
   it's run.
#>
Take initial configuration snapshot
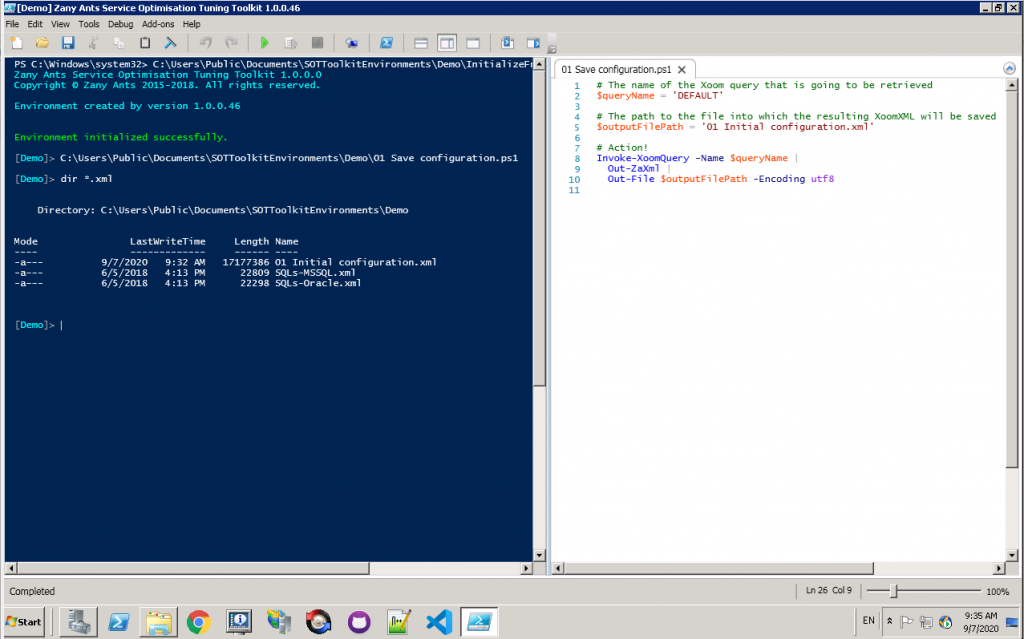
Because we have Xoom available in this case, we add an additional step at the very start of the process and, depending on need, at other stages of the process. This step is saving configuration for future reference. Xoom customers will often already have configured configuration versioning on a routine basis. For those who haven’t done so, this is one way to create a configuration snapshot at the start of the process that allows you to easily identify the changes that were made during it.
In order to do this, open file “01 Save configuration.ps1” in ISE, change the Xoom query name and optionally file name, and run (F5). In our demo environment, we changed query name to DEFAULT and left the rest.
Data analysis and preparation
There are many ways in which the structure of the data itself can cause problems with Service Optimization performance. For example, a significant imbalance between the requirements of the tasks and the capabilities of resources, either in general capacity, geographical distribution, skill levels or time distribution, will cause long-term problems that software itself can do very little to address. Similarly, a workflow that allows dispatchers to pin assignments without a good reason will result in a schedule that cannot be optimized by Service Optimization because there are just too many unmovable assignments blocking good options from consideration.
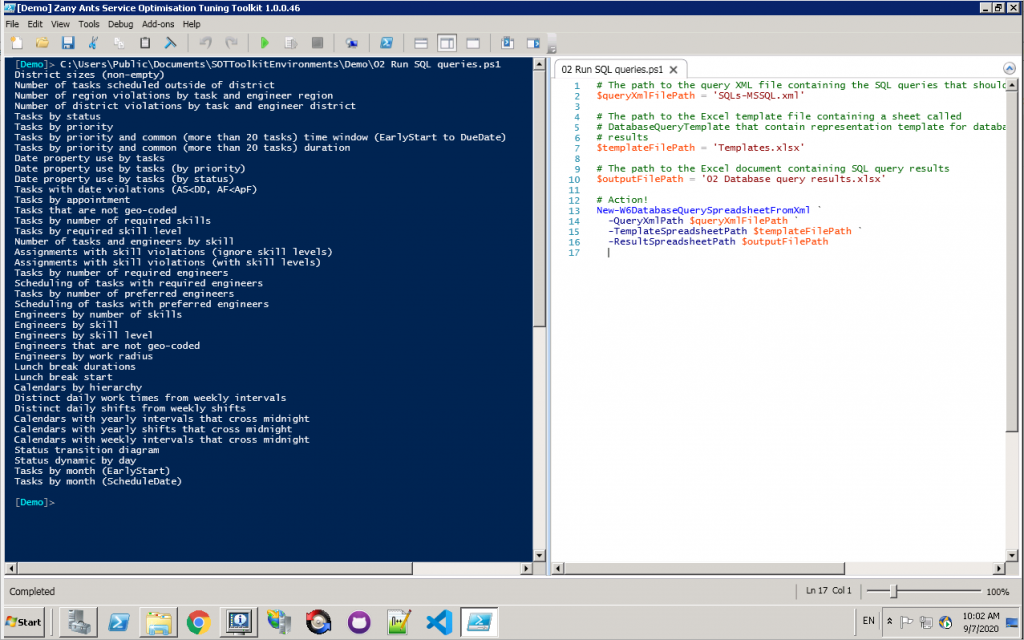
While there are many aspects of this work that will be done using various tools, a good portion of it is done by running database queries. The Toolkit allows you to automatically run queries and store their results, and the starter kit brings a good initial set of queries and a script that runs them and saves them nicely into an Excel file. In order to do this, open “02 Run SQL queries.ps1”, change any parameters at the top (typically none) and run. While running, the script will report the queries that it’s running, and store the result in the named file.
The resulting file will look something like this (as displayed by LibreOffice Calc):
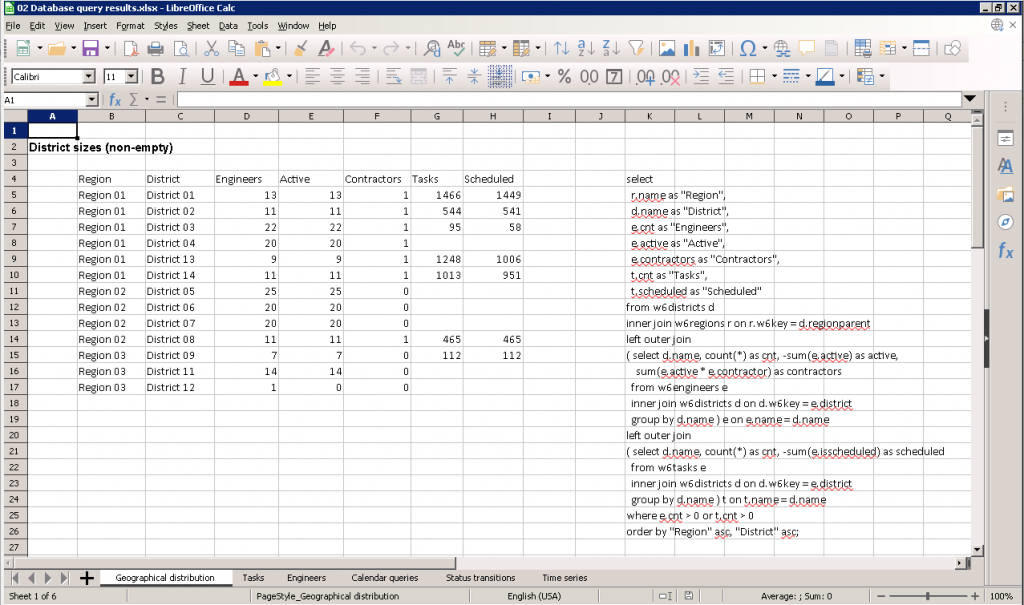
Query results will be grouped into different thematic worksheets. Within each worksheet, the queries will be placed below each other in the order in which they are listed in the query XML file (see parameters). Query name in bold will be placed above the results, and to the right there is going to be the SQL that was used that can also be copied into any other SQL tool for further exploration and experimentation.
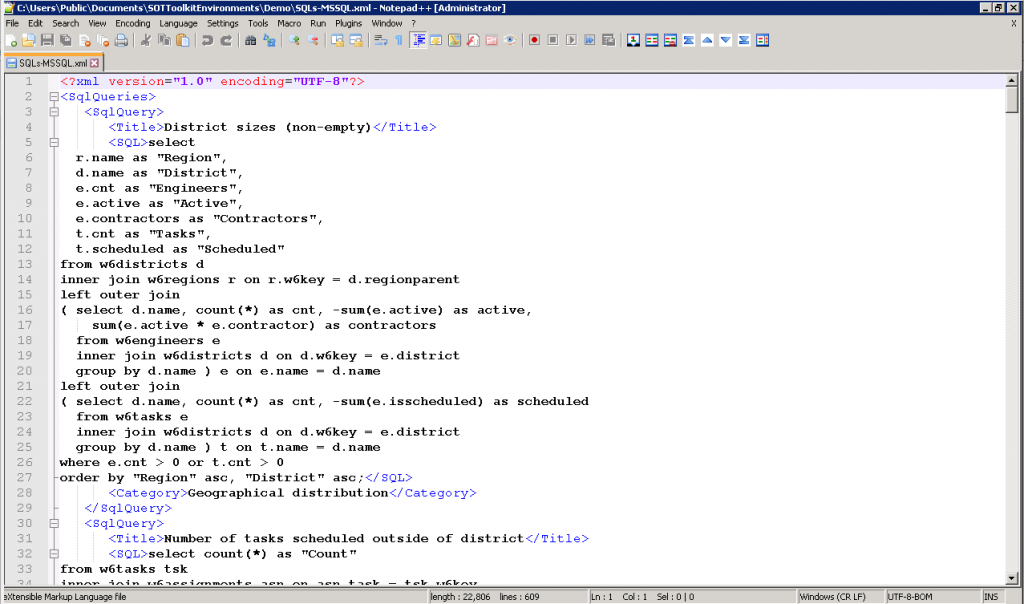
Query XML file, in this example “SQLs-MSSQL.xml”, can be edited in order to adjust the queries, remove irrelevant ones and add new ones. Its structure is:
- The root element is SqlQueries.
- Each query is in its own SqlQuery element.
- Query name is specified inside the element called Title.
- The SQL is specified in the element name called SQL. The formatting, including leading spaces and newlines, is preserved when the Excel document is created.
- Finally, the element Category specifies the name of the worksheet onto which the result will be placed.
Configuration reports
Creating Xoom configuration reports and exploring them is a great way to get a quick understanding about the Service Optimization configuration at the start of the process. The reports also be recreated later on in order to understand the changes that were made and the scenarios that were tested from a more functional point of view.
In order to create the configuration reports, open script “03 Produce Xoom reports.ps1”, make any changes to the parameters, and run.
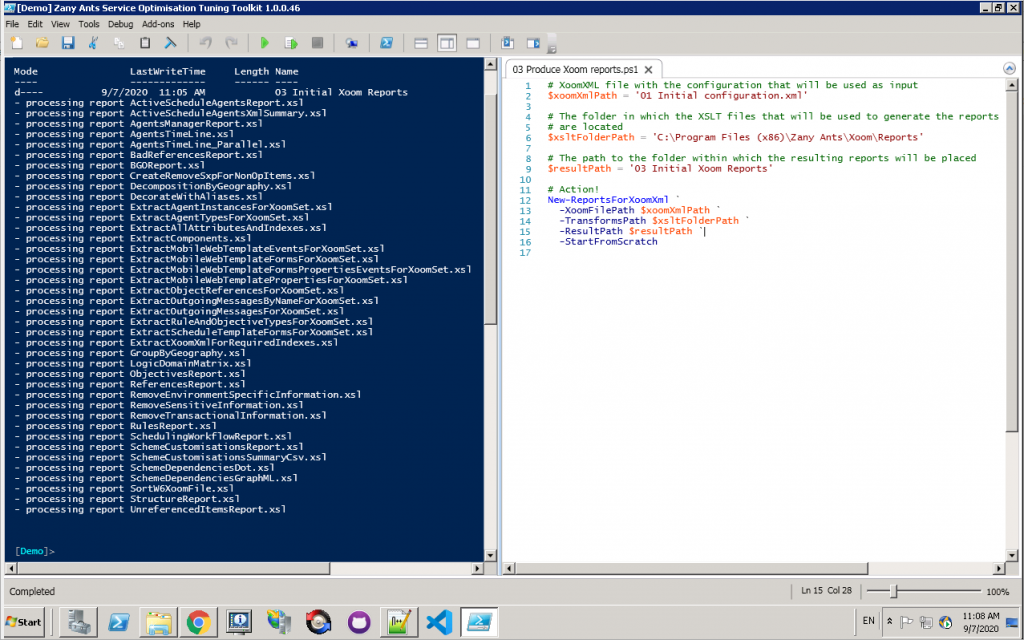
No parameter changes are typically required, at least not during the initial run assuming the Xoom file name from script 01 remained at its default value. However, if the reports are produced at a later stage again it may be a good practice to place them into a separate folder in order to be able to compare. An alternative would be to put the whole environment folder under revision control, in which case all that’s needed is to create a commit with a suitable comment and the changes can be reviewed as needed later on.
The script will run all transformations found in the XSLT folder, and place the results into the result path (see parameters). The result folder will be created by the script. The result will be something like this:
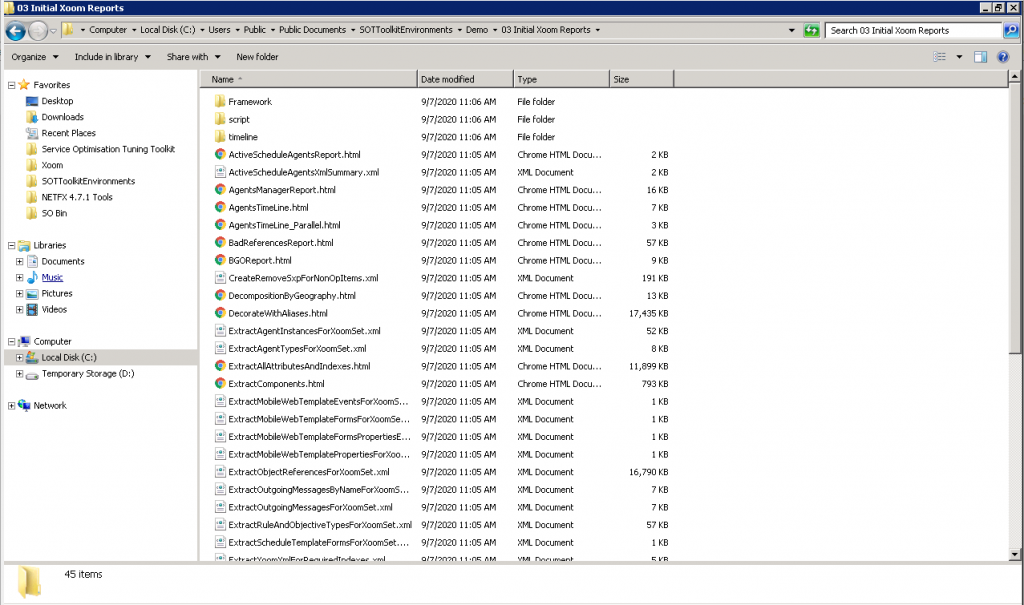
All supporting files will be in place, so HTML reports can be opened by simply double-clicking.
Detailed documentation about Xoom reports can be found in Xoom Documentation Library, but some of the most relevant in the context of SOT are:
- Rules report and Objectives report.
- Logic domains matrix.
- Decompositions report.
- BGO report.
- Active schedule agents report.
Experiments
Having developed a good understanding of the data and familiarity with the configuration, you are now ready to configure the measurements that you will want to collect when running experiments and see what configuration produces what results.
Measurements
Before we can run any experiments, we need to define what we want to measure. We will explore measurement definitions, naming and related subjects in this section.
Because measurement definitions are shared between different scripts, we use the shared file “90 Custom.ps1” to define them. This file does not contain simple parameters at the top, so search for “TODO:” in order to find the sections that require your attention. We will give a quick comment on each of them here.
The first section defines task measurements:
  # TODO: Review the measurements below and perform suitable modifications using provided examples.

  # Task measurements for all tasks and by priority are almost always required
  $Measurements |
    Add-W6TaskMeasurements -TasksXml $TasksXml -PassThru |
    Add-W6TaskMeasurements -TasksXml $TasksXml -GroupByTaskProperty Priority -MeasurementFormat '{0}P{1}'

  # Example: Add task measurements grouped by task type.
  <#
  $Measurements |
    Add-W6TaskMeasurements -TasksXml $TasksXml -GroupByTaskProperty TaskType -MeasurementFormat '{0}TT{1}'
  #>

  # Example: Add a SQL-based measurement of the number of tasks by task type.
  # Get-W6TaskTypeTaskSqlForArea function that is used here is defined lower in this file.
  <#
  $Measurements |
    Add-Member `
      'SqlTaskCountByTaskType' `
      ( ( Invoke-W6DatabaseQuery -Query ( $Context | Get-W6TaskTypeTaskSqlForArea ) ).Response ) `
      -Force # This flag is used by convention throughout the toolkit to allow overwriting existing measurements
  #>
Task measurements measure only tasks, and their result will be the same for all scenarios. They outline the outer envelope of what is theoretically possible in scheduling terms. By default (lines 4-6), the starter kit includes the basic measurements for all tasks in the domain and also groups those measurements by Priority. Basic measurements include the number of tasks (TaskCount), total task duration (TaskDurD in days and TaskDurH in hours) and, somewhat redundantly, average task duration (AvgTaskDurD in days and AvgTaskDurMin in minutes).
Note: Each duration and offset measurement comes in two variants: the natural unit (typically hours or minutes) and days. The latter one is made available in order to make it easy to use Excel formatting features for time data, as those expect times expressed as fractions of days.
When defining measurement groupings (lines 6 and 11), the MeasurementFormat parameter specifies how the measurement name for each group will be calculated. For example, TaskCount measurement for tasks of Priority 1 will be TaskCountP1 as {0} in the MeasurementFormat will be replaced by the measurement name (in this case TaskCount) and {1} will be replaced with group property value (in this case 1).
Below the default measurements in lines 4-6, we have examples of how this can be extended. For example, if you uncomment lines 10-11, then the grouping of task measurements by task type will also be added.
The next TODO concerns schedule measurements:
  # TODO: Review the measurements below and perform suitable modifications using provided examples.

  # In the simplest case we have default measurements that contain the default assignment
  # counts and durations (total and grouped by task priority), travel time measurements,
  # utilization measurements, and counts of number of assignments per engineer and per
  # segment of work time. The inspection of the resulting $Measurements object is highly
  # advisable.
  $Measurements |
    Add-W6ScheduleMeasurements `
      -Context $Context `
      -Force:$Force
The comment describes the default measurements. Again, the Toolkit measures assignment count, total duration and average duration, overall and grouped by Priority. It also includes measurements of all kinds of travel times (from and to home, between assignments, total), utilization (taking into account overlap with work time or not) and various engineer performance indicators (number of assignments per engineer, active engineer, work time segment and active segment). The measurements are very rich, and inspection of the relevant code is advised if you require deeper understanding.
Immediately below the above code with the default measurements is a commented-out block demonstrating a number of additional measurements. We’ll uncomment it here for readability:
  # Example: A more advanced measurement demonstrating additional features. This should
  # replace the above call (as opposed to be added to it) in order to avoid the duplication
  # of data retrieval from Service Optimization and the calculation of measurements that
  # are present in both cases.
  # This example adds the following measurements:
  # - parameter StartOffsetTaskProperties: adds the measurement of the average offset between
  #   task's early start and the corresponding assignment start
  # - parameter FinishOffsetTaskProperties: adds the measurement of the average offset
  #   between assignment finish and the corresponding task's due date
  # - parameter GroupByProperties: adds grouping by task type
  # - parameter CustomMeasurements: this is an open extensibility point taking a script block
  #   which in this case adds the following measurements:
  #   * PreferredEngMatchCount: the number of assignments that are scheduled to one of their
  #     task's preferred engineers.
  #   * SubMinuteTravelCount: the number of times that the travel bewteen two consecutive
  #     assignments is under a minute.
  #   * SqlAsnCountByTaskType: SQL-based measurement (resulting in a DataSet object) counting
  #     the number of assignments by task type. See also the description and parameters of
  #     the function Get-W6TaskTypeAssignmentSqlForArea defined below.
  $Measurements |
    Add-W6ScheduleMeasurements `
      -Context $Context `
      -StartOffsetTaskProperties EarlyStart `
      -FinishOffsetTaskProperties DueDate `
      -GroupByProperties @( ( New-W6SotGroupByProperty -Property TaskType -Shortcut TT ) ) `
      -CustomMeasurements `
        {
          $_.Measurements |
            Add-Member `
              PreferredEngMatchCount `
              ( ( $_.TimedThings |
                    %{
                      $eid = $_.Engineer.ID
                      @( $_.TimedThings | ?{ $_.EngineerScheduleAppointment.Task.PreferredEngineers.ID -eq $eid } ).Count
                    } ) | Measure-Object -Sum ).Sum `
              -Force -PassThru |
            Add-Member `
              FirstInDayWithMatchingTaskTypeCount `
              ( ( $_.TimedThings |
                    %{
                      $_.TimedThings |
                        # Extract all proper assignments (not NA)
                        ?{ [string] $_.Type -eq 'Appointment' -and -not $_.IsNA } |
                        # Group by date
                        Group-Object -Property { $_.Start.Date } |
                        # Count first assignments of day with matching task type
                        %{ if ( [string] ( ( $_.Group | Sort-Object -Property Start )[0].EngineerScheduleAppointment.Task.TaskType ) -eq 'DesiredTaskType' ) { 1 } else { 0 } }
                    } ) | Measure-Object -Sum ).Sum `
              -Force -PassThru |
            Add-Member `
              SubMinuteTravelCount `
              ( Get-W6SameSiteCount -TimedThings $_.TimedThings -SameSiteTimeLimit ( New-Object TimeSpan -ArgumentList 0, 1, 0 ) ) `
              -Force -PassThru |
            Add-Member `
              SqlAsnCountByTaskType `
              ( ( Invoke-W6DatabaseQuery -Query ( $Context | Get-W6TaskTypeAssignmentSqlForArea ) ).Response ) `
              -Force
        } `
      -Force:$Force
So what do we have here? Quite a lot, actually:
- Line 23 means that we’ll measure the average time span between the given property (in this case EarlyStart) and assignment start.
- Line 24 means that we’ll measure the average time span between assignment finish and the given property (in this case DueDate).
- In line 25 we introduce grouping by task type. In this case, shortcut “TT” specifies the letters that will be between measurement name and the group property value, e.g.
AsnCountTTElectricsfor the number of assignments with task type Electrics. - Lines 26-58 demonstrate how completely custom measurements can be added. These measurements require the understanding of the underlying data structures, but since ISE allows setting breakpoints it is relatively easy to stop at the right point in the code and explore the data structures as they actually are. The measurements here are:
- Lines 29-36 count the number of assignments where preferred engineer is matched, resulting in a measurement called
PreferredEngMatchCount. - Lines 37-48 count the number of cases where the first assignment of the day has a specific task type (in this case “DesiredTaskType” as this is just a demonstration) resulting in a measurement called
FirstInDayWithMatchingTaskTypeCount. - Lines 50-53 count the number of cases where travel time between consecutive assignments is less than a minute, called
SubMinuteTravelCount. - Lines 54-57 demonstrate how to use a database query to perform measurements. While this is possible, it has a drawback as any future re-measurement will require a full schedule reconstruction inside Service Optimization, which is much slower than simply computing measurements locally.
- Lines 29-36 count the number of assignments where preferred engineer is matched, resulting in a measurement called
The next TODO has to do with reconstruction objects:
  # TODO: Review to ensure that all important data is included, while large irrelevant properties are excluded.
  Export-W6SotReconstructionObject `
    -LiteralPath $LiteralPath `
    -Context $Context `
    -Measurements $Measurements `
    -Property @{
      SotProject = New-Object PSObject -Property @{
        ContextTemplate = $SotProject.ContextTemplate
        Decomposition = $SotProject.Decomposition
        Agent = $SotProject.Agent
        TaskOptimisationDate = $SotProject.TaskOptimisationDate
        UnscheduledTaskStatus = $SotProject.UnscheduledTaskStatus
        Districts = $SotProject.Districts
        BGOs = $SotProject.BGOs
        ResultDocumentName = $SotProject.ResultDocumentName
      }
    }
Reconstruction objects contain the data required to reconstruct the schedule and also to perform re-measurements, should additional measurements be required at a later stage of the SOT. Typically, you don’t need to change anything here as re-measurement can always be performed through reconstruction.
The last three TODOs (optimization date, required properties, unscheduled task status) are very important, but also relatively simple and well documented in the code file itself, so we won’t devote any more space to them here. Just make sure that they are set to the values that make sense in your case.
Measurement templates
Now that you defined your measurements, it is time to decide how those measurements are going to be represented in an informative way.
The starter kit contains an Excel file called Templates.xlsx. The purpose of this file is to define what the results of measurements and also of SQL queries will look like. We will skip the SQL queries bit as those rarely need changing, and focus instead on measurements.
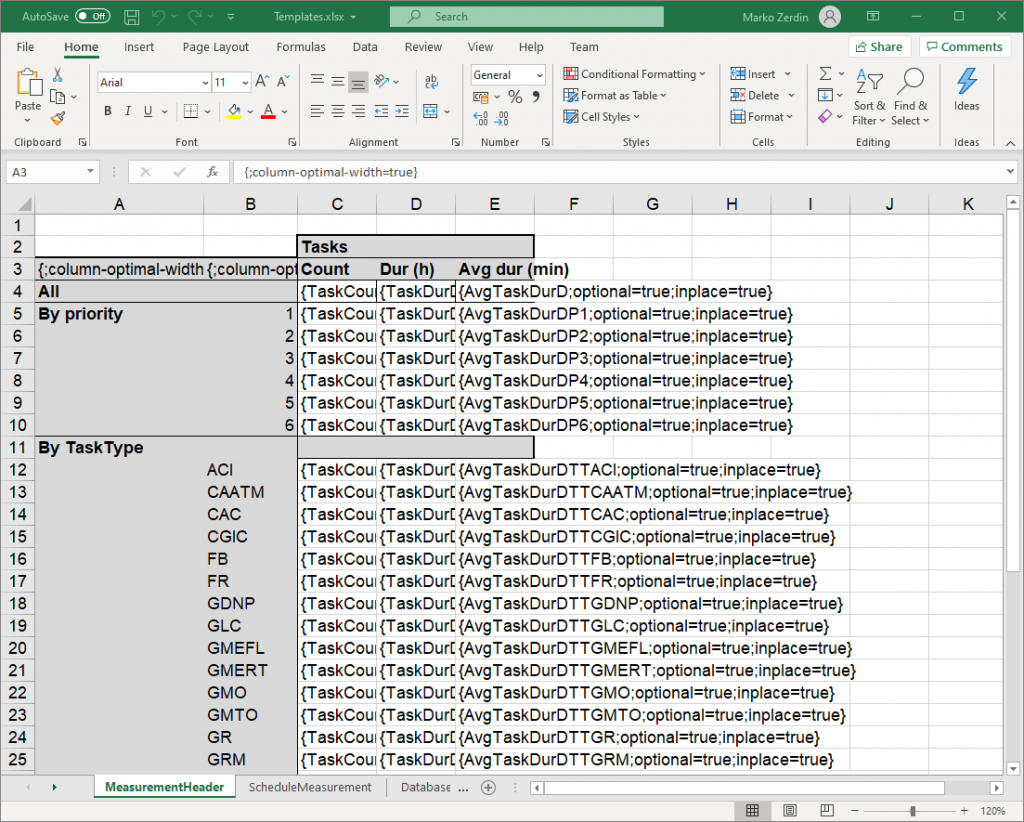
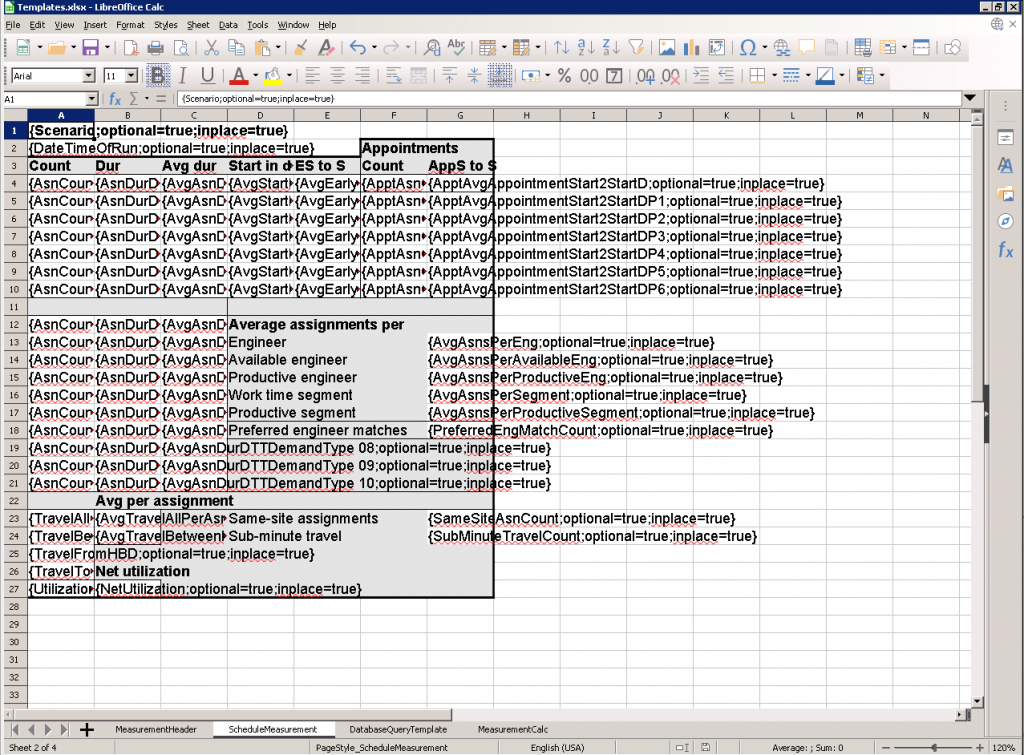
There are two worksheets that are important here. The first one, MeasurementHeader, defines the presentation of task measurements. One instance of these will be placed at the very top left corner of the worksheet for each territory. By default, the template looks like this:
The second worksheet of importance is ScheduleMeasurement. One of these will be placed to the right of the previous content for every new experiment.
The way these presentation templates work is that everything, including text, background colour, cell formatting and borders, gets copied to the result worksheet as it is in the template. Only the fields with the content in curly braces will be parsed by the layout engine for the measurement placeholders they may be and additional processing instructions that they give.
This whole templating system is very powerful and quite intricate, but we’ll try to keep it simple and to the point here, so let’s take a look at an examples. Field E5 of MeasurementHeader contains the following:
{AvgTaskDurD;optional=true;inplace=true}The field has the following parts:
- The first part after the opening curly brace is the name of the measurement, which is optional. If measurement name is not present, then the rest of the field will still be parsed for processing instructions that are independent of the measurement.
- In this case, we have a measurement called
AvgTaskDurDP1, which means that this is a placeholder for average task duration of priority 1 tasks with the unit of days. The reason the unit of days is important is because then we use cell formatting to represent the results in a readable way, in this case this:
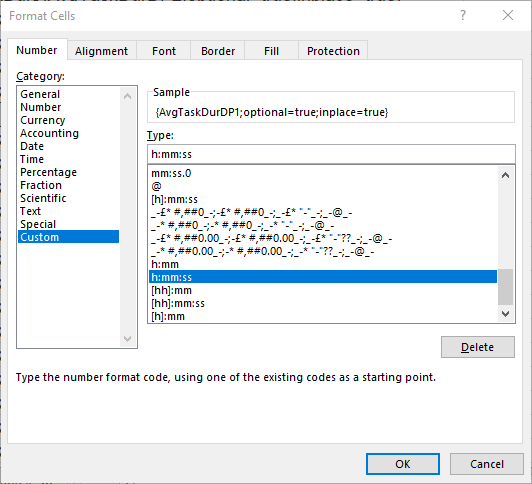
optional=truemeans that this measurement is optional. This means that it’s not an error if the measurement doesn’t exist because there are no priority 1 tasks.inplace=truemeans that the measurement should be inserted in place. Setting this tofalse(which is the default) will mean that the layout engine will grow the placeholder cell into a table that can accommodate the whole recordset, moving everything around to the right and down. This is a desirable behaviour for example in the case of SQL queries, but not here. The guidance is to always putinplace=truefor single measurements.
You can either completely reformat the whole template to suit your requirement, or simply add additional measurements to the template by following the example above, replacing the measurement name and formatting as required.
Once the template has been defined, it is a good idea to test it before running experiments to make sure that the results will be presented well. That’s the purpose of the script “10 Test measurement.ps1”. Let’s demonstrate.
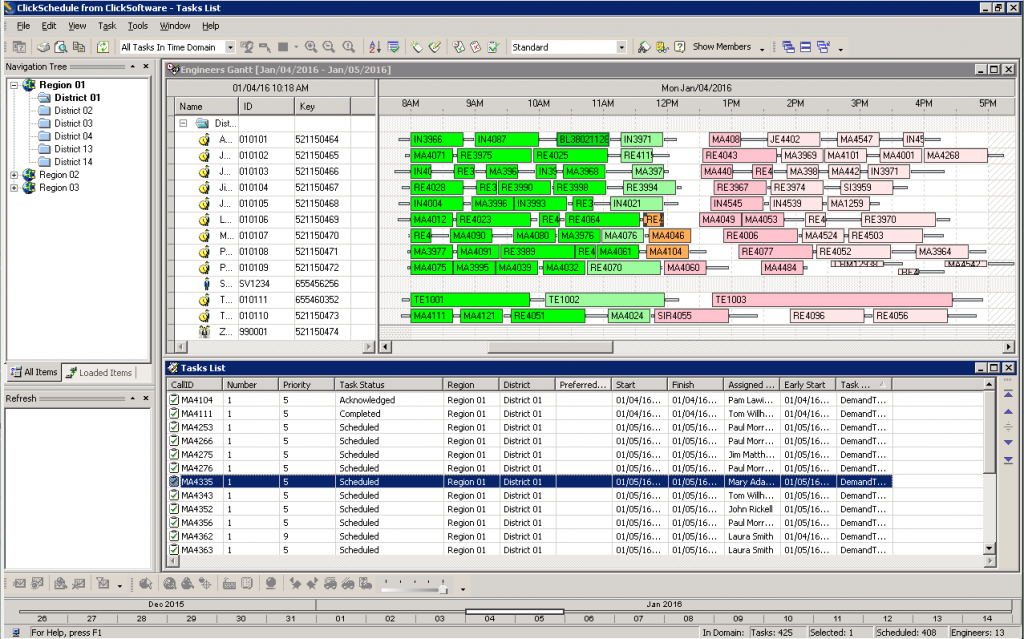
This demonstration will happen on Service Optimization 8.3 Patch 16 with starter kit database. In order to test the measurements, we’ll look at a single day, 5 January 2016, in District 01. This is what the Gantt looks like:
In order to perform this test, we will include the default task measurements plus task type grouping, as well as all examples from the larger schedule measurements example that was discussed above. This is what the domain part of the script looks like:
# Create the context defining the domain
# TODO: Review all parameters in order to make them relevant to the project.
$context = New-W6SotContext `
  -Region 'Region 01' -District 'District 01' `
  -TaskOptimisationDate EarlyStart `
  -Start ( [ datetime ] "2016-01-04T00:00:00" ) `
  -Finish ( [ datetime ] "2016-01-05T00:00:00" ) `
  -TaskRequestedProperties EarlyStart, DueDate, TaskType
After running the script with the unchanged Templates.xlsx document, we get the following result:
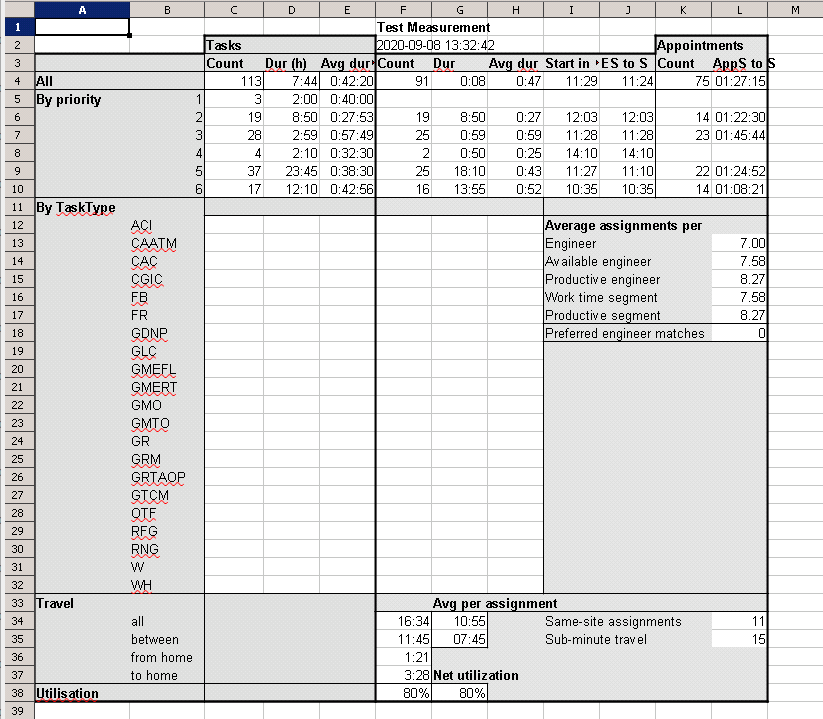
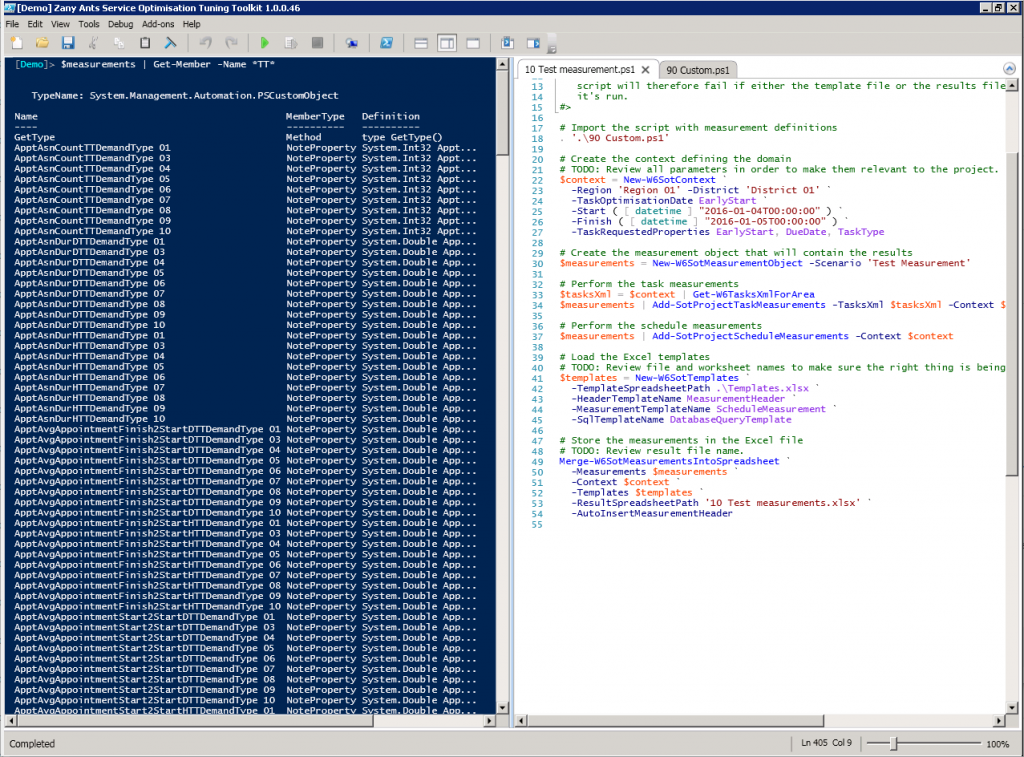
It’s a good start, but task types seem to be wrong. If we take a look at the actual measurements by displaying the measurement object ($measurements) properties that contain “TT” in the ISE, we see why:
The actual task types encountered in the sample have a form DemandType XX, where XX goes from 01 to 10. Let’s modify the template (both the header and the schedule) to reflect that. There is a handy worksheet called MeasurementCalc in Templates.xlsx that generates all the formulas required by simply replacing the task type names. The schedule template after the change looks like this:
Because we changed both the task and schedule templates, we now need to delete the file “10 Test measurements.xlsx” in order to regenerate task measurements, as task measurements are only performed once for each territory. Also, don’t forget to close the template file before running the script as both Excel and OpenOffice lock open files, and the script will fail if the file remains open. After running the script again, we get the following result:
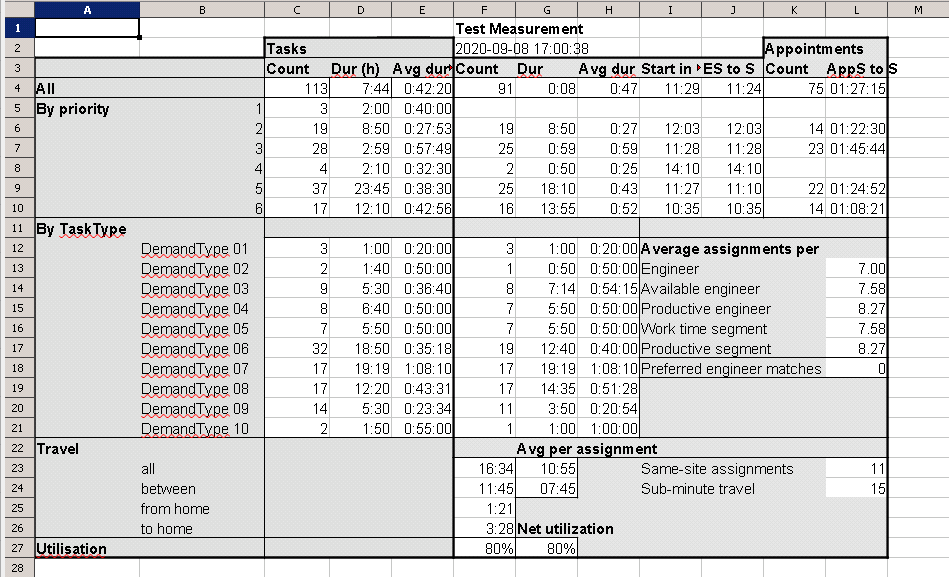
This is more like it, we are quite happy with this. Time for optimization experiments.
Preparing for experiments
There are a few more steps we need to take before performing experiments.
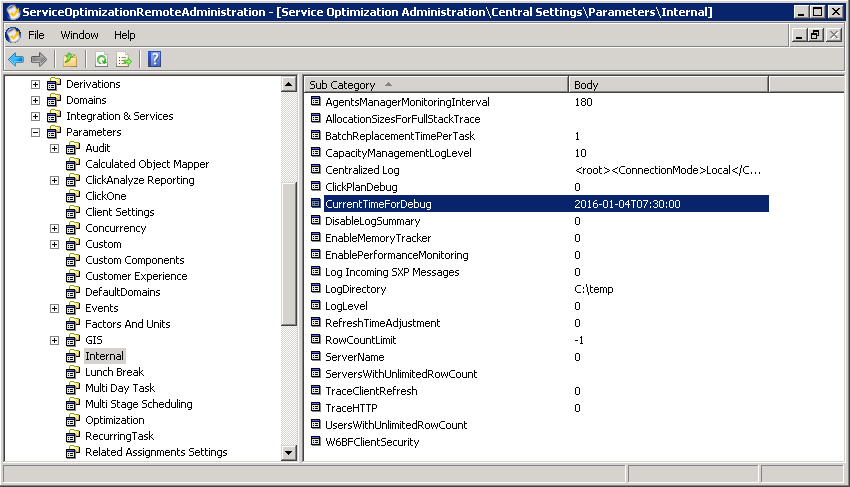
First, as we are working on historical data, we need to take Service Optimization back into that time, which means we need to set the internal CurrentTimeForDebug setting. In our case, we’ll set it to 7:30 on 4 January 2016:
Next, we need to set the scenarios, which comprise of the following settings:
- SOT decomposition. When using the starter kit, a single decomposition will be used for all scenarios. While the territories will be set programmatically, the important bits are the indexes (including the use of the right date property to determine the problem domain), days to optimize and work days. In our case, we’ll name the decomposition “[SOT] Decomposition” to make it clear what’s its purpose.
- Background optimization instances which are synonymous with scenarios when using the starter kit. You can vary anything from the kinds of optimization steps to the logic domains and optimizers, but not the decomposition. When using the starter kit, all scenarios need to use the same decomposition. (Note: If you really need to use different decompositions, for example to compare optimization by district vs soft boundaries, you can do that by either using multiple SOT Toolkit environments, each one with its own starter kit configuration, or different SOT projects. We will not go any further here, so please ask for advice if this is required.)
Like with the decomposition, we use prefix [SOT] in the names of BGOs in order to make their intention clear. We’ll have three scenarios in this demonstration: “[SOT] Standard”, “[SOT] Use Overtime”, and “[SOT] Pure Travel”. - A background optimization agent that will be used for the SOT. We’ll call ours “[SOT] BGO Agent”.
In order to make all scenario runs comparable to each other, we need to make sure that all tasks that will take part in the optimization are unscheduled and in the proper unscheduled status, in our case Open. The reason this is important is to ensure that all scenarios start from the same initial situation. When we use the starter kit, we run all scenarios over all territories one after another, and the script deletes the Gantt between each two consecutive runs. Hence, it’s important that the Gantt is also empty to start with. Also, having tasks of different statuses present will skew the situation, because it might result in events preventing certain scenarios from performing as well as they would otherwise.
There are different ways of achieving this. In our case, we used the following script that takes advantage of SOT Toolkit’s capabilities and bypasses server events in order to delete the assignments rapidly, in this case over the period of 20 days in January 2016 in the two districts that are going to be used for the demonstration:
$context = New-W6SotContext `
             -Region 'Region 01' `
             -District 'District 01' `
             -TaskOptimisationDate 'EarlyStart' `
             -Start '2016-01-01' -Finish '2016-01-20'

@( 'District 01', 'District 02' ) |
  %{
    $context.District = $_
    $context |
      Remove-W6Assignments `
        -UseSql `
        -UnscheduledTaskStatus Open `
        -IncludeAssignmentCriteria
  }
Finally, before running the whole set set of experiments, it is a good practice to verify that everything is set up correctly and that the optimization, as configured in Service Optimization, actually work. A good way of doing this is to run the SOT BGO agent (as mentioned above). You can do this either using Agents Manager with a single run, or by running the following command (with the appropriate agent name substituted) from your ISE environment:
Invoke-W6BgoAgent -AgentName '[SOT] BGO Agent'Once the agent has completed its run, make sure that the Gantt actually contains meaningful amount of assignments, and that you are not getting any strange errors in the event log or elsewhere. Be aware that this is pure Service Optimization functionality, so if this doesn’t work then the Toolkit won’t be able to schedule things successfully either.
Do not forget to delete the assignments again once you’re done with this test.
Running experiments
We are ready to run our first big experiment. Before doing anything else, restart ISE to make sure that Xoom will start with a completely new session that will retrieve everything fresh and not rely on an outdated copy. (With regular use of Xoom this is typically not a problem, but SOT Toolkit persists the same session for a long time in order to achieve better performance over what can be quite long runs of experiments, so this is important.)
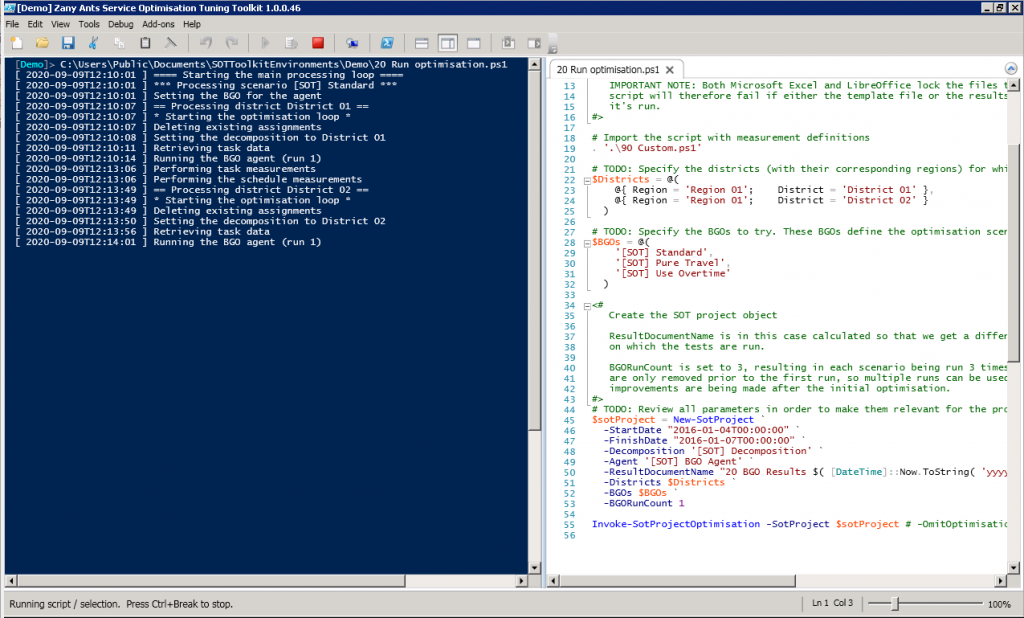
Open script “20 Run optimization.ps1” in ISE, and modify all necessary parameters, following the usual TODO signposts. In our case, the relevant parts of the script (skipping comment blocks that are actually required reading before the first run!) look like this:
# Import the script with measurement definitions
. '.\90 Custom.ps1'

# TODO: Specify the districts (with their corresponding regions) for which the optimisation will be run
$Districts = @(
    @{ Region = 'Region 01';    District = 'District 01' },
    @{ Region = 'Region 01';    District = 'District 02' }
  )

# TODO: Specify the BGOs to try. These BGOs define the optimisation scenarios that are being tested.
$BGOs = @(
    '[SOT] Standard',
    '[SOT] Pure Travel',
    '[SOT] Use Overtime'
  )

# TODO: Review all parameters in order to make them relevant for the project.
$sotProject = New-SotProject `
  -StartDate "2016-01-04T00:00:00" `
  -FinishDate "2016-01-07T00:00:00" `
  -Decomposition '[SOT] Decomposition' `
  -Agent '[SOT] BGO Agent' `
  -ResultDocumentName "20 BGO Results $( [DateTime]::Now.ToString( 'yyyy-MM-dd' ) ).xlsx" `
  -Districts $Districts `
  -BGOs $BGOs `
  -BGORunCount 1

Invoke-SotProjectOptimisation -SotProject $sotProject # -OmitOptimisationRun
To summarize: our domain will be two districts (lines 6-7) over three days (lines 19-20), we’ll test the three scenarios mentioned above (lines 12-14) and we’ll have a single optimization run per scenario and district (line 26).
Once you made all appropriate changes to your own script, kick off the run by pressing F5, sit back and enjoy.